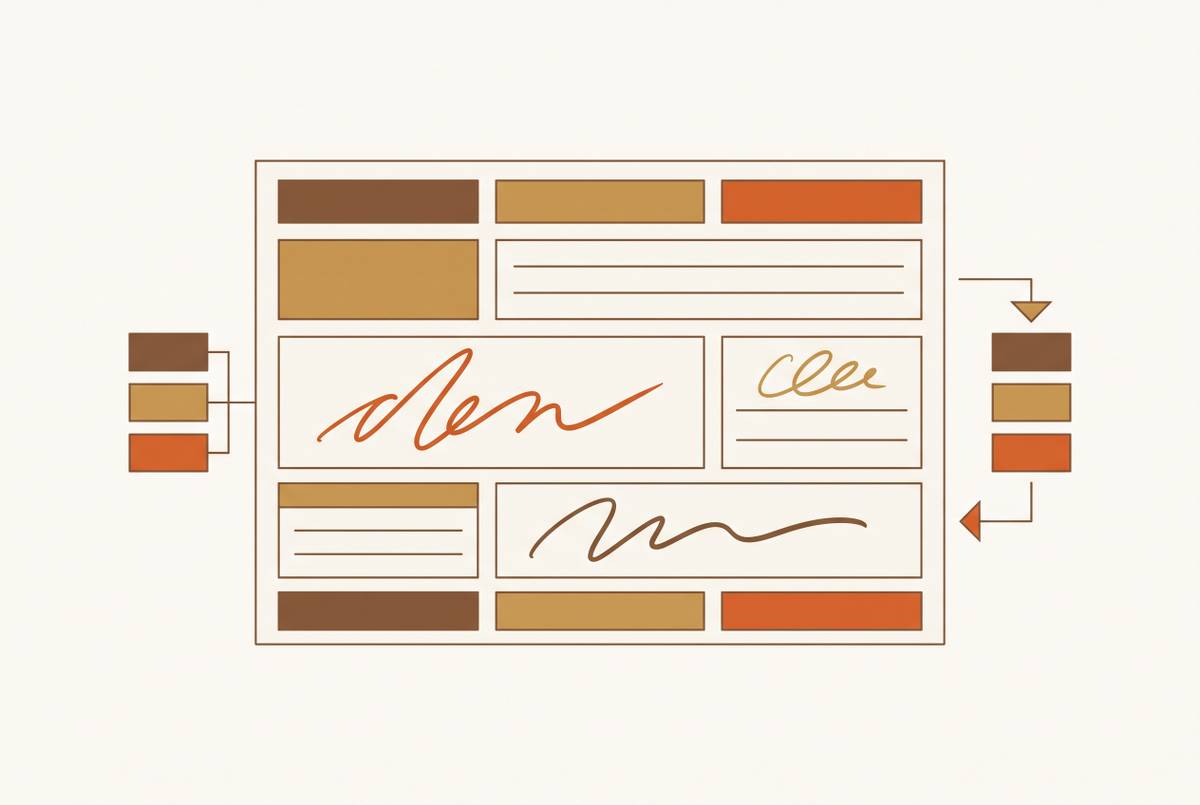
Per-Field Accuracy Measurement for Production Document Pipelines
Field-level accuracy reveals extraction failures that character metrics miss entirely.

Character accuracy is the wrong number, and it keeps telling engineering teams a pipeline works when it doesn't. A document can score above 95% on character-level accuracy while the fields that actually matter, the invoice total, the account number, the due date, can come out wrong between 40 and 60% of the time on complex or variable-layout forms. Those two figures aren't measuring different degrees of the same thing. They're answering different questions, and only one of them predicts what happens once the pipeline hits production.
The gap exists because errors compound differently at each level. Misread a single digit in an account number and the character-level score barely moves, one wrong character out of maybe fifteen. But the field itself is now completely wrong. A downstream system doesn't pay a partial amount of an invoice or apply a payment to a "close enough" account number. It either gets the field right or it doesn't, and character accuracy has no way to say which. Teams benchmarking vendors on transcription fidelity are optimizing for a signal that has nothing to do with extraction correctness: it can't say whether a field was found at all, whether the right value got bound to the right label, whether a row silently vanished from a table, or whether a multi-page structure came back in one piece. A pipeline that looks clean in a benchmark demo often falls apart the moment real documents start varying in layout, and that gap is the whole subject of what follows.
What "field accuracy" actually measures and why it maps to production outcomes
Per-field accuracy asks a simpler, harder question: for each named field in a schema, invoice number, total amount, due date, vendor name, did the extracted value match the ground truth? It's a near-binary judgment made field by field, not a similarity score smeared across a page of text. That distinction matters because downstream systems act on fields, not on characters. A wrong invoice total triggers a wrong payment no matter how many surrounding characters got transcribed perfectly.
A second distinction is worth holding onto: per-field accuracy versus per-document accuracy. Per-field accuracy asks what share of individual fields, across every document processed, came out correct. Per-document accuracy asks what share of documents had zero errors across all their fields. That second number is stricter, and regulated industries treat it as the more meaningful threshold, because a document with one wrong field out of twenty is still a document that failed.
The math here doesn't forgive much. Take a pipeline running at high per-field accuracy across twenty fields on a document, a level that sounds strong on its own. The odds of that document coming out with zero errors land around 0.97 raised to the twentieth power, roughly 55%. Nearly half the documents processed will contain at least one field error, even though the per-field number looks close to flawless. Modern AI-based extractors can hit very high field accuracy on clean, well-structured documents, and that's the wrong thing to celebrate. The real question is what happens once documents stop being clean, and field accuracy is the filter that exposes the answer. An extractor that drops a row or misreads a label corrupts everything downstream that depends on it.
The production failure modes that field-level metrics expose and character metrics hide
Most of this traces back to the PDF format itself. PDFs are built for visual fidelity, not machine readability. Even a single born-digital PDF can carry figures, tables, embedded media, and text placed at arbitrary coordinates with no inherent reading order. Parsing that reliably is hard, and the ways it fails don't show up as character errors.
Tables running into the thousands of rows can lose rows silently: no error thrown, no signal that anything went missing, the output just looks complete. A value can get extracted with perfect character fidelity and still bind to the wrong label, so character accuracy stays high while field accuracy drops to zero. Tables spanning multiple physical pages sometimes fracture into two unrelated tables at the page boundary. NVIDIA's 2024 Annual Report offers a real case: its Exhibit Index table, run through a naive text extractor, breaks across the page split, exhibit numbers separate from their descriptions, and a downstream LLM reading that broken structure can produce outputs that have no basis in the original document.
Other failures are quieter but no less damaging. Reading order can come out wrong even when the table structure itself is preserved, so an agent pulls the right value from the wrong context. Technical symbols get mutated in ways that look trivial at the character level but change the meaning entirely: a unit symbol mutated by a single character is an order-of-magnitude error hiding behind what looks like a trivial transcription difference. Header metadata, a product's brand or model number, sometimes disappears from the reconstruction entirely. And in the worst case, extractors invent values outright when the source content was ambiguous or missing, handing back a number with no basis anywhere in the original document.
Dropping an entire page is the most severe failure, and it shows up even in parsers that otherwise post the best results on clean, easy documents. Struggling pages leave behind observable symptoms: empty output, unusually short text, heavy repetition, garbled characters, or large chunks of visible content that never made it into the extraction. These symptoms are catchable, but only if the evaluation framework is built to look for them, and character accuracy isn't built that way. A dropped row scores as zero characters wrong, because there's nothing there to compare against. A hallucinated value can score a high similarity match against nearby text purely by coincidence. A misaligned label never touches the character comparison at all, because the characters themselves were read correctly, they just ended up attached to the wrong field. Retrieval-augmented generation systems built on top of bad extraction inherit that damage directly, and financial or medical reasoning built on garbled input produces garbled conclusions no matter how capable the reasoning model is.
How to construct a ground truth evaluation framework for field-level measurement
None of this means anything without ground truth. Field accuracy only means something when it's measured against manually verified reference values, not against a model's own confidence in its output, and not against a synthetic test set built to be easy.
Building the evaluation corpus starts with stratified sampling: pulling documents across the full range of layout types, dense prose pages, pages heavy with footnotes, title pages, pages with illustrations, tables of every shape, so the hard cases show up in the sample instead of getting averaged away by easy ones. A sample of 200 documents gives a margin of error around plus or minus 4% at a 90% confidence level, tight enough to support real decisions about whether a pipeline is ready. One study on NOAA cloud seeding reports processed 832 historical documents and built ground truth by having two independent human annotators manually review 200 randomly sampled records against the original PDFs, arriving at an estimated accuracy of 98.38%. That's disciplined ground truth construction at production scale: not a spot check, a structured audit with independent human review.
The annotation process needs its own guardrails. Multiple domain experts working from a shared transcription guideline cut down on variance between annotators. Structural elements, table headers, merged cells, the order fields should be read in, need manual verification rather than the assumption that a model produced them correctly. And inter-annotator agreement should get measured, not assumed: research on per-field selective risk control, run blind across multiple annotators, reported a Fleiss' kappa of 0.83, high enough to say the human-labeled ground truth itself holds up.
Scoring at the field level calls for different tools depending on field type, and picking one metric to cover everything is where a lot of evaluation frameworks quietly fail. String fields work well with normalized Levenshtein similarity, a continuous score between zero and one that captures how close a predicted value is to the ground truth. Numeric fields need a tolerance-based comparator instead: a rounding difference shouldn't fail a field, but a unit error, mH read as nH, absolutely has to. From there, two aggregate metrics answer different questions. Weighted Output Agreement takes the mean of per-field continuous scores across everything evaluated, giving partial credit and a sense of overall drift. F1 with a binary acceptance threshold only counts fields that are exact or near-exact matches, and a pipeline can post a strong WOA score while still failing on strict F1. Neither replaces the other, and picking just one because it's easier to report is how a team fools itself. What separates a real evaluation from a demo is deliberate inclusion of the hard cases: dense tables, structures spanning multiple pages, inconsistent layouts, handwriting, low-resolution scans. The easy documents will always look fine.
Confidence scores: what they measure, how they fail, and how to calibrate them
Confidence scores exist to catch what field accuracy checks can't catch in real time: an uncertain extraction gets routed to a human reviewer instead of passing silently downstream and causing a payment error three steps later. A well-calibrated confidence score is a genuine probability statement, not a ranking of relative certainty. If a field is flagged at a given confidence level, roughly that same share of fields flagged at that level should actually be correct.
Production audits show confidence varies sharply by field type, and that variation is exactly why a single threshold applied across every field is a mistake, arguably the most common one teams make when they deploy these systems. One document intelligence model reported an overall average field-level confidence of 0.781, but that average hides real spread: minimum payment amount scored 0.89, helped by consistent numeric formatting, statement balance came in at 0.779, and payment due date landed at just 0.675, dragged down by inconsistent layout and placement that shifts from document to document. Apply one confidence threshold across all three, and the system over-accepts risky date fields while over-rejecting amount fields that were actually reliable.
Before even asking whether a confidence score's absolute values can be trusted, AUROC is the diagnostic that checks whether the score can tell correct predictions apart from incorrect ones at all, its discriminative power. From there, production systems need concrete recalibration triggers: when high-confidence predictions consistently fail to match ground truth at the rate the score implies, the confidence model needs retraining.
A study running selective risk control across 13,859 fields on 800 CORD receipts, where field correctness sat at 49.0%, surfaced three specific ways naive confidence thresholding breaks. Fields within the same document aren't statistically independent of each other, and that clustering effect, measured at a design effect of 1.84 to 2.45, roughly cuts the effective calibration sample size in half without anyone noticing. Fitting a learned score and its acceptance threshold on the same data produces a coverage of 0.416 at a risk of 0.127 against a target risk of 0.10, meaning the guarantee gets violated in 95% of test splits, a straightforward case of leakage. And a degenerate score distribution can collapse the threshold grid entirely, causing certified coverage to crash toward zero. The fix that study landed on was a strict fit/validation split, which restored proper selective risk control: 0.318 coverage at a 0.096 risk against the 0.10 target, an honest operating point rather than a false guarantee. A vendor's confidence scores are rarely calibrated in the statistical sense out of the box, and treating them as if they were is a mistake worth naming plainly. Checking calibration against a team's own document corpus is the difference between a number that means something and one that just looks like it does.
How benchmark scores on clean documents fail to predict production accuracy
Clean-document benchmarks and production accuracy are two different measurements wearing the same clothes. Extraction accuracy on a tidy test set doesn't predict what happens once documents include long arrays, dense forms, or handwritten fields, and this shows up in published benchmark numbers rather than staying a theoretical worry.
The LongArray-Extract benchmark, run in 2026 on PDFs containing arrays up to thousands of rows long, put that gap in plain numbers. One standard parsing tool reached well under half in mean extraction accuracy on it. A different processing approach hit a substantially higher rate. A third reached near-perfect accuracy with a full run completion rate across all 45 test PDFs, a detail that matters because failed runs get scored as zero rather than quietly excluded. On a separate benchmark, RealDoc-Bench, a lighter-weight parsing approach reached strong field-level accuracy at a very low cost per page, a different tier suited to high-volume, straightforward documents rather than the hardest edge cases.
Model choice for field extraction carries its own cost-accuracy tradeoff, and chasing the top scorer on a leaderboard is usually the wrong instinct. A 2026 study running 200 NOAA weather modification reports through different LLMs found one model, o4-mini, reaching 94.72% overall field-level accuracy at roughly $0.005 per document. A more capable model, o3, reached 96.33%, the highest accuracy in the study, but at roughly $0.05 per document, ten times the cost for a modest gain. Which one is right depends on how costly a wrong field actually is in the specific pipeline being built, not on which model tops a chart in the abstract. Most teams should default to the cheaper model and reserve the expensive one for fields where an error carries real financial or legal weight.
Benchmark design choices do a lot of quiet work behind these numbers. Whether a benchmark includes long arrays and hard edge cases or sticks to clean, short documents changes the result substantially. Whether failed runs count as a zero or get excluded from the average flatters or punishes a tool depending on how forgiving the methodology is. And whether the benchmark measures field accuracy at all, rather than character or token similarity, decides whether the number means anything for a production decision. The current landscape of table extraction tools spans agentic cloud pipelines and open-source local deployments, each suited to a different operating model. The question worth asking of any vendor isn't what their headline number is. It's whether that number came from a benchmark that resembles the documents actually running through the pipeline, or from a demo document picked because it happens to parse well.
What a production-grade measurement pipeline looks like end to end
Measurement isn't a box to check before launch, and treating it that way is how pipelines quietly rot in production. Document layouts shift, new document types get added, model behavior drifts over time. The measurement pipeline has to run continuously, not as a one-time audit before deployment.
A working setup needs a stratified evaluation corpus that stays maintained and versioned, covering the full range of layouts the pipeline actually sees in production, including the rare and awkward cases that don't show up in a quick sample. It needs a ground truth store built from human-verified values per field, with inter-annotator agreement tracked over time rather than assumed. Scoring should run per field, using continuous similarity measures for tracking and F1 with an acceptance threshold for SLA reporting, broken out by field type and document type rather than collapsed into one aggregate score that hides where the real problems live.
Confidence calibration needs its own recurring check: AUROC and selective risk metrics run against every new model version, with recalibration triggered when high-confidence predictions no longer match ground truth at the rate the score implies against ground truth. Thresholds need segmenting by field type, separate cutoffs for amount fields, date fields, and identifier fields, because a single uniform threshold, as the confidence data shows, will always fail one category to protect another.
Fields falling below the calibrated threshold need to route into a human review queue rather than pass downstream unchecked. The research on valid per-field selective risk control found that with a strict fit/validation split in place, the system achieved an honest operating point within the target risk budget, a clear demonstration that proper calibration does most of the heavy lifting in keeping errors out of production systems. And corrections made during review shouldn't disappear once the document is processed. Feeding them back into the model so it learns from the same failure patterns is what separates an actual document AI product from a static OCR tool that never improves on its own mistakes.
Sources
- Valid Per-Field Selective Risk Control for Document Extraction:Three Failure Modes, a Validity Ladder, and When Conditioning Pays
- Structured dataset of reported cloud seeding activities in the United States (2000-2025) using an LLM
- AI Document Extraction Accuracy: What the Benchmarks Actually Mean
- 1. Introduction
- Beyond Logprobs: A Multi-Signal Confidence Engine for LLM-Based Document Field Extraction
- ExtractBench: A Benchmark and Evaluation Methodology for Complex Structured Extraction
- Multi-Stage Field Extraction of Financial Documents with OCR and Compact Vision-Language Models
- medium.com